Insights & Reports
Our custom-built reports solve your specific problems and provide tailored insights.
This collection of report pages demonstrates the breadth of questions each report can answer for clients. Reports are built using Google Looker Studio (formerly Google Data Studio). Monthly reports typically range from 10 to 40 pages; the needs of the client determines the number of pages.
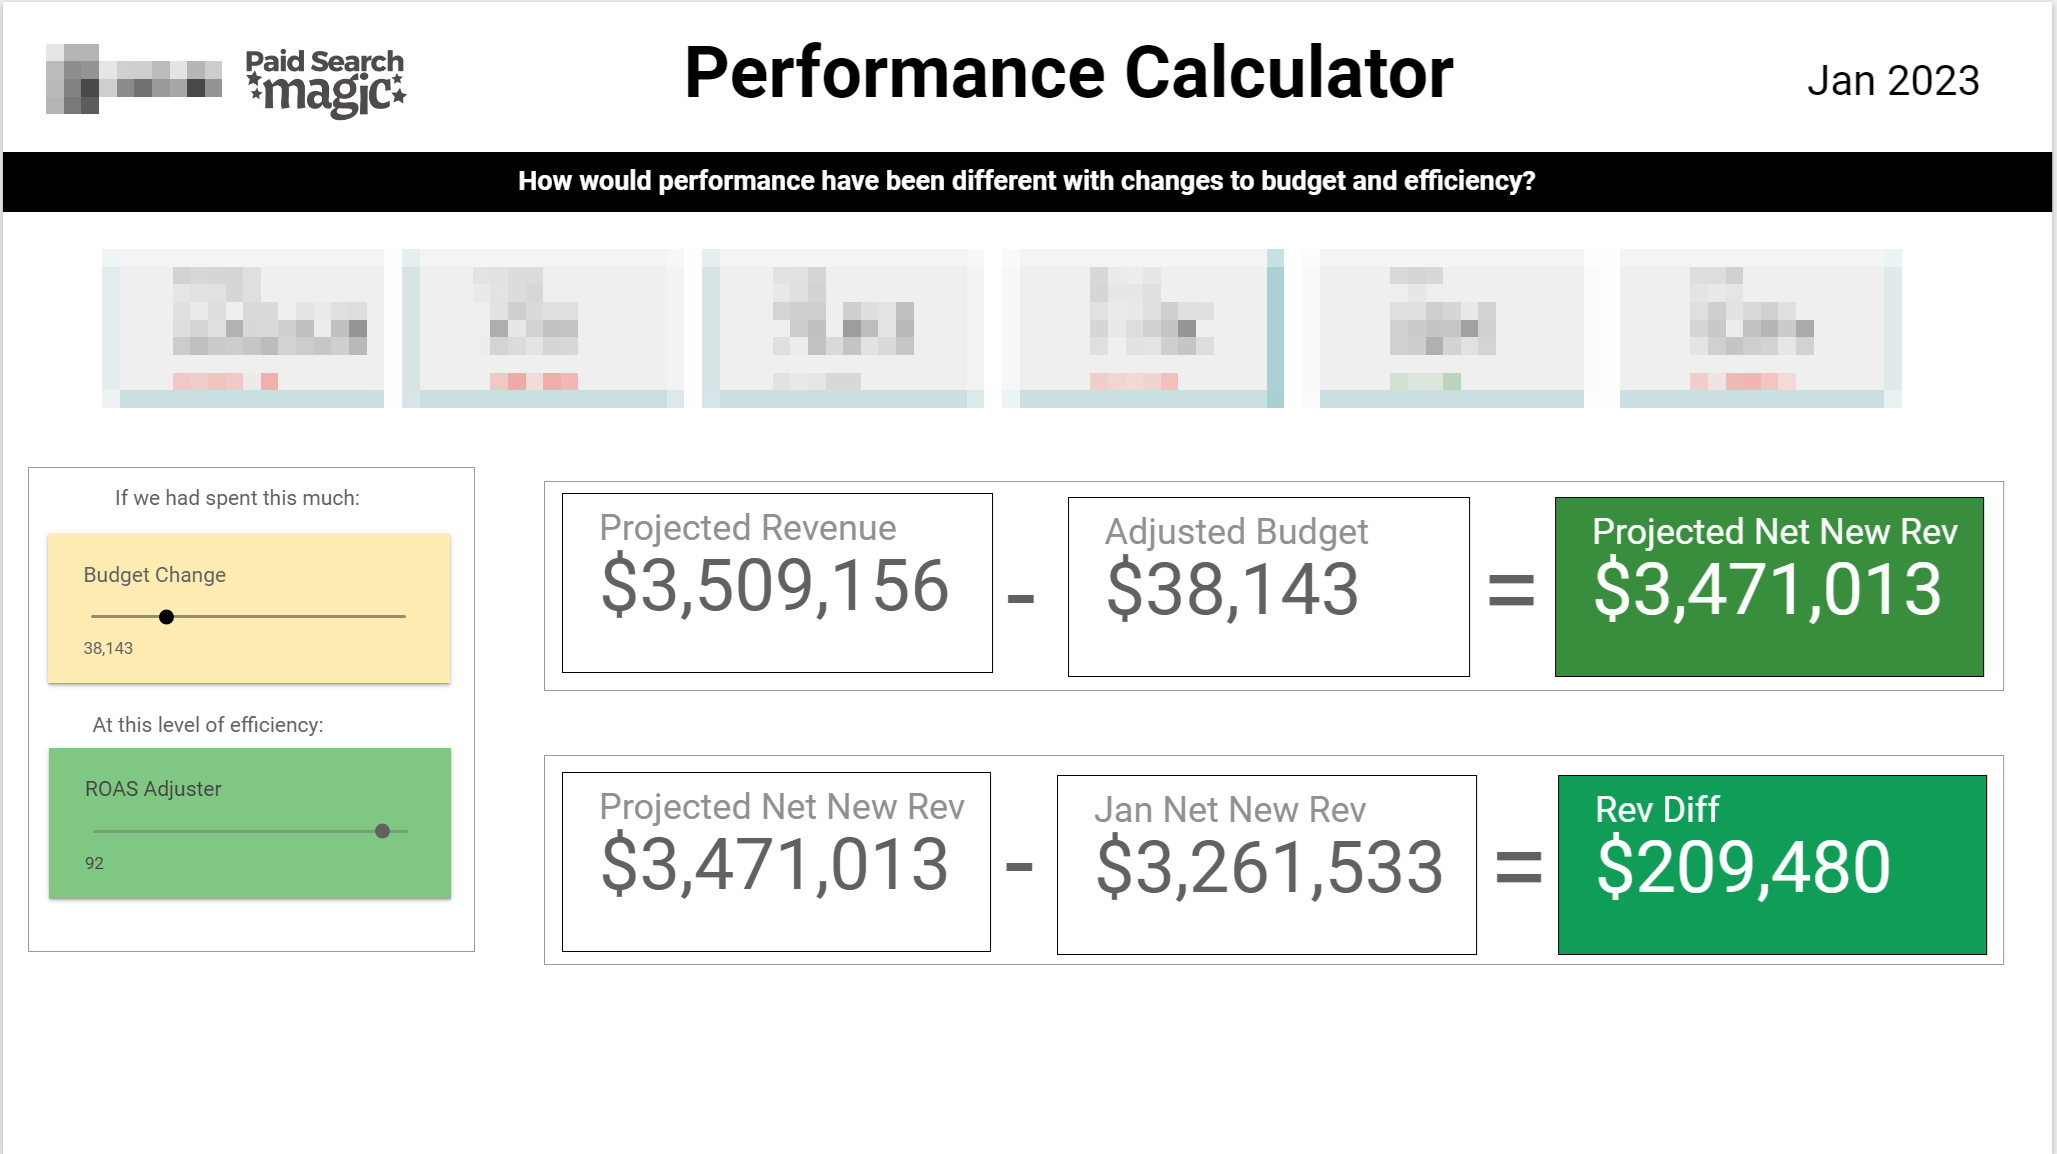
Challenge: The client needed to answer "what if" questions about the impact of increasing the budget, involving several variables and moving parts.
Solution: This report page includes custom parameters as sliders, allowing the team to create their own scenarios and projections at different levels of spend and efficiency.
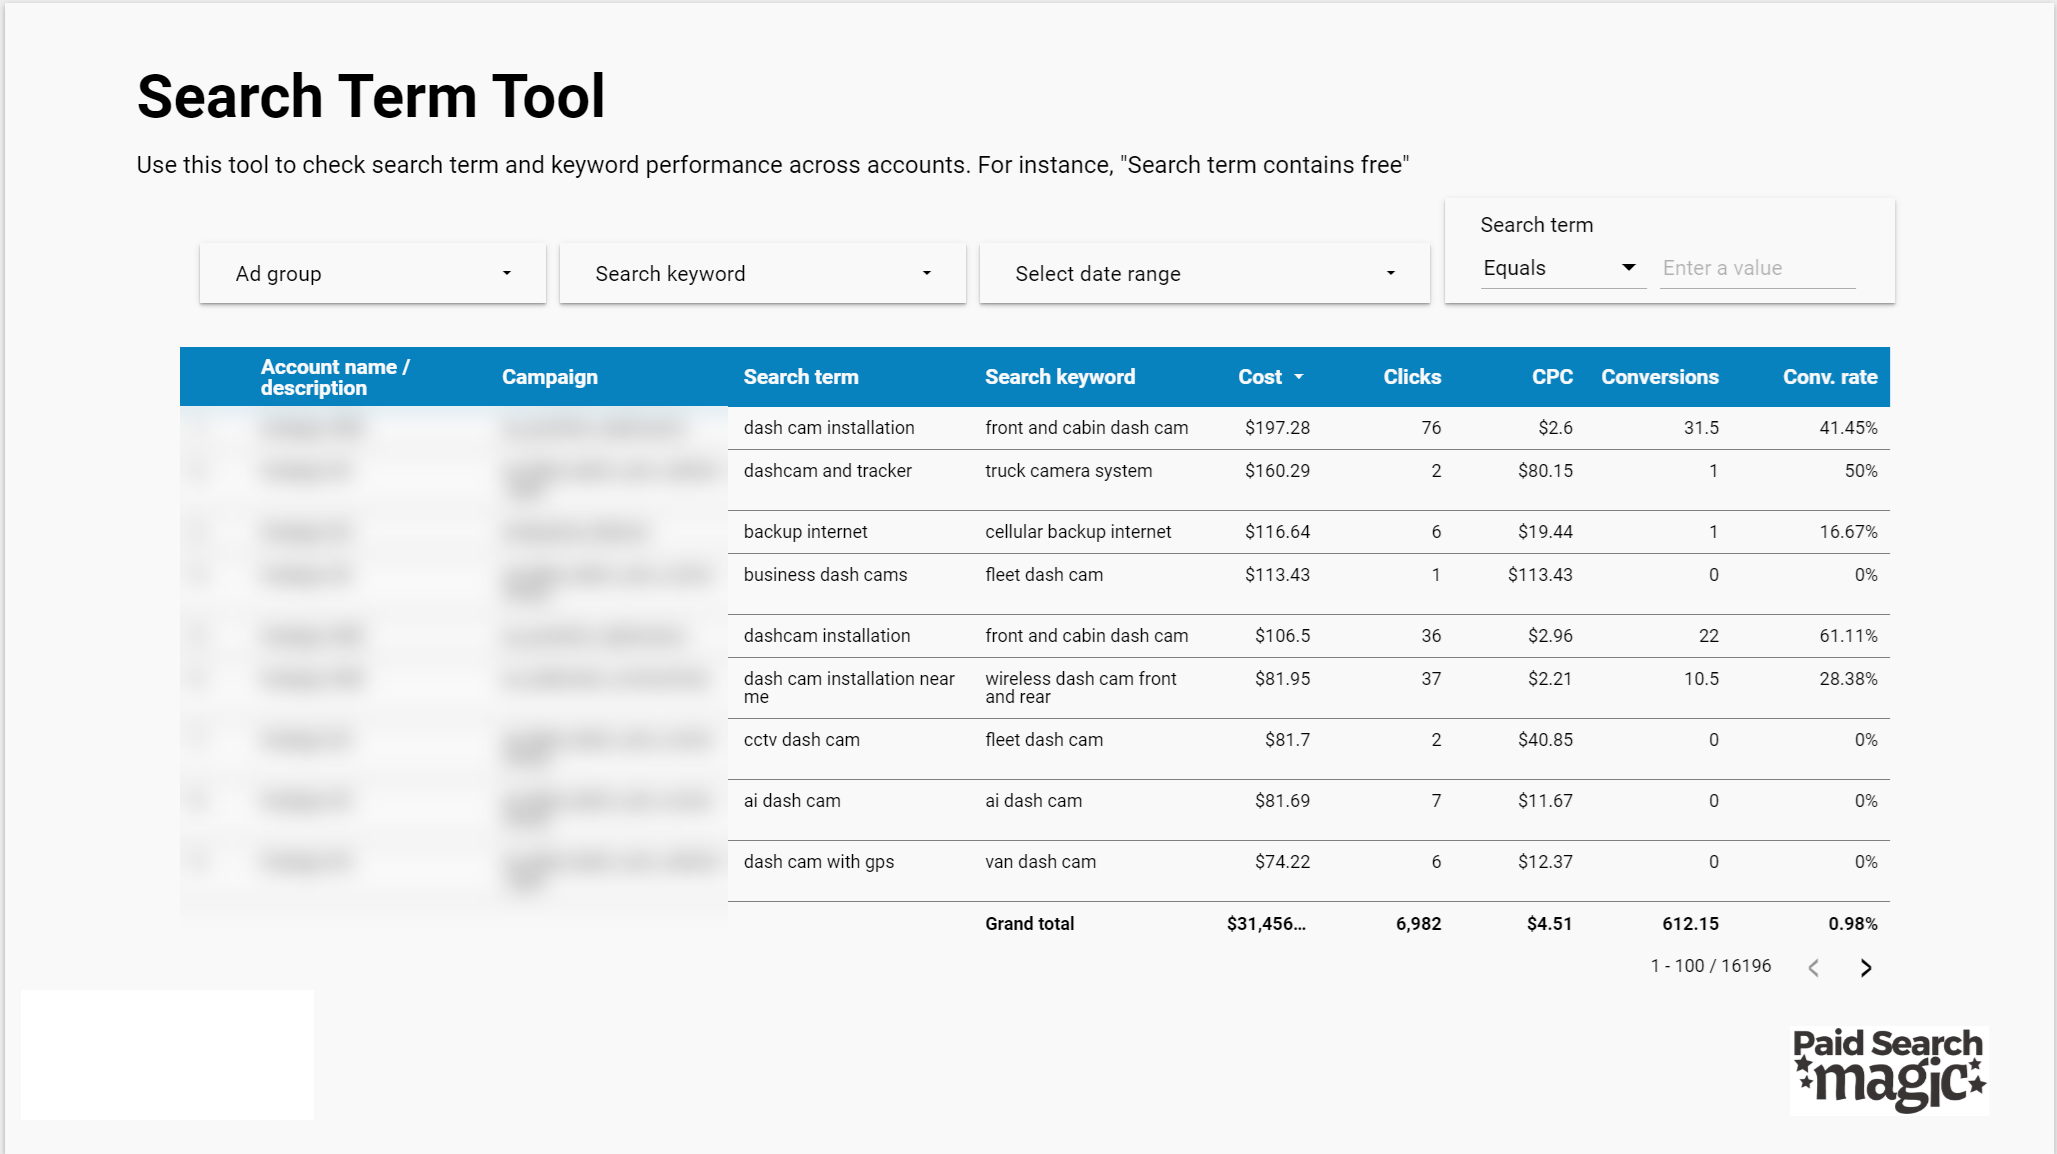
Challenge: A consulting client was concerned about search keyword performance and overlap, not just across campaigns, but across multiple accounts. They needed a quick way to evaluate the keyword landscape.
Solution: This self-service report page makes it much easier for the client to get search-term level data across accounts.
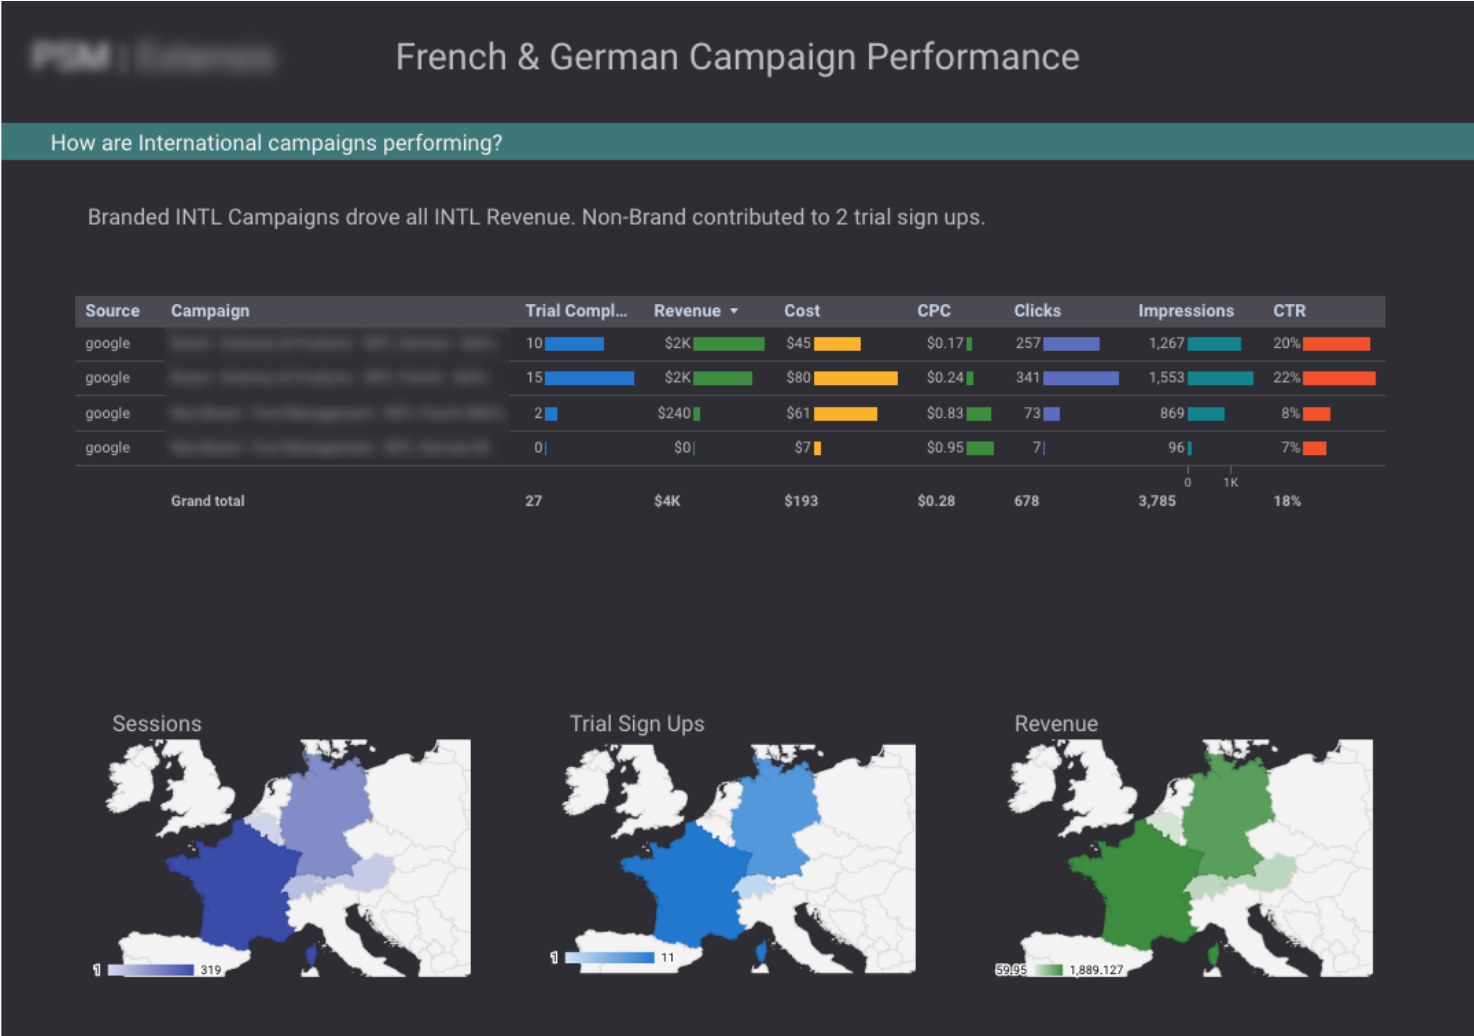
Challenge: The client needed to see country-level performance of campaigns in Europe.
Solution: This report page offers detailed metrics with in-line bar charts and a map view to visualize sessions, signups, and revenue by country.
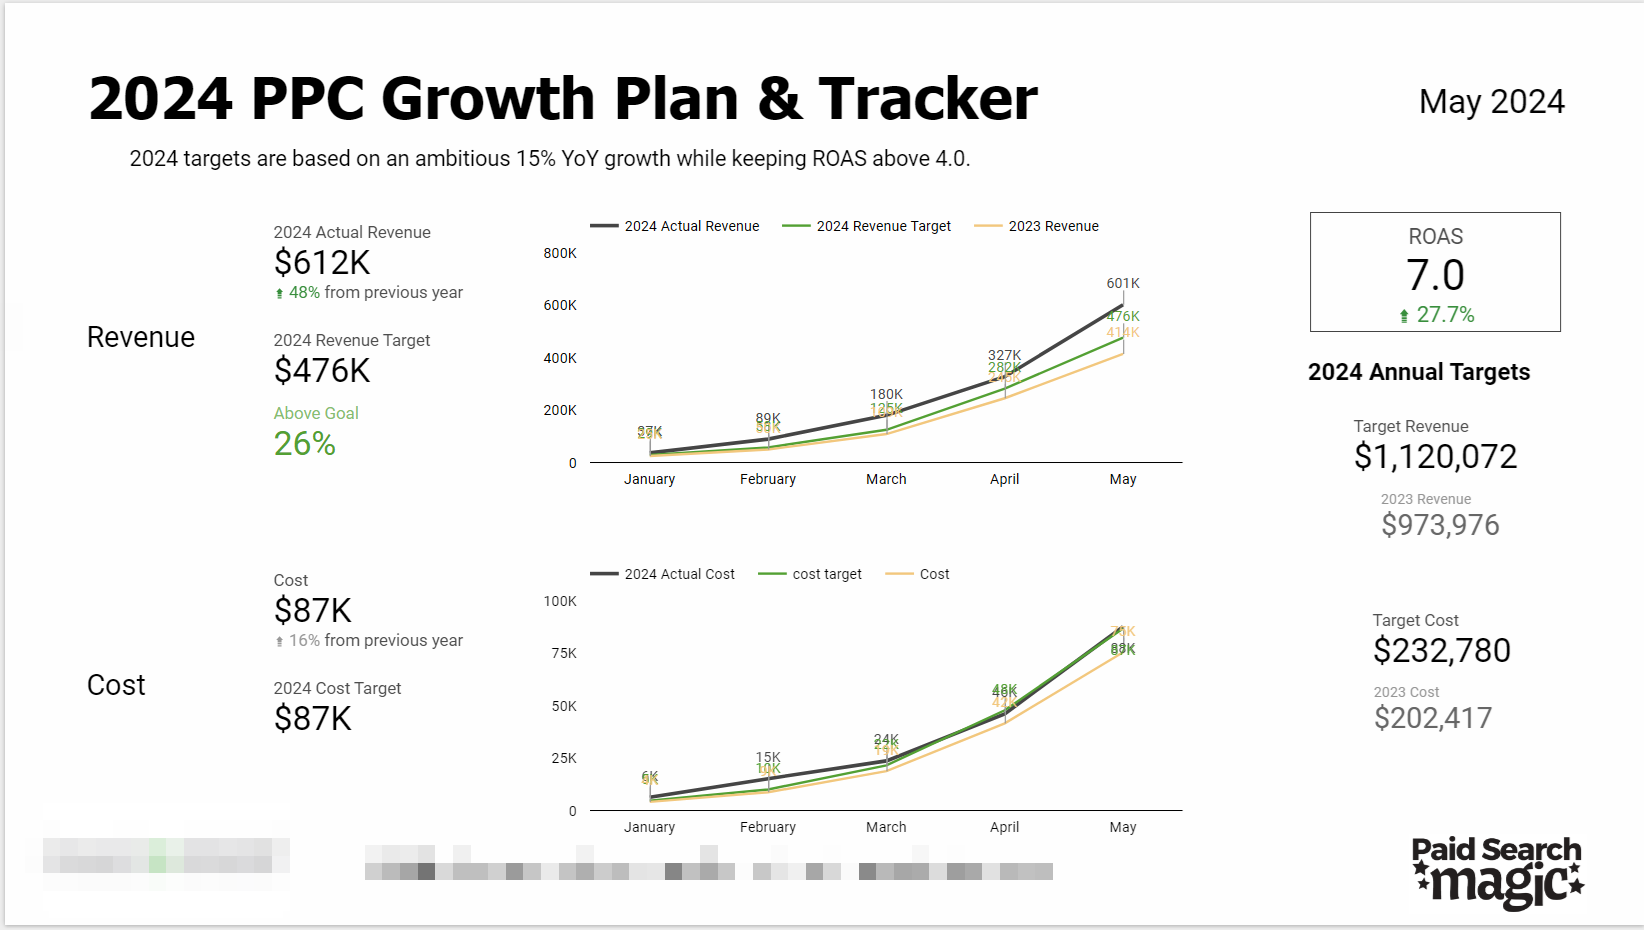
Challenge: The client needed to track their seasonal account's year-to-date performance against this year's goals and previous performance.
Solution: This report page provides KPIs and time series comparisons to show trends and current performance relative to goals.
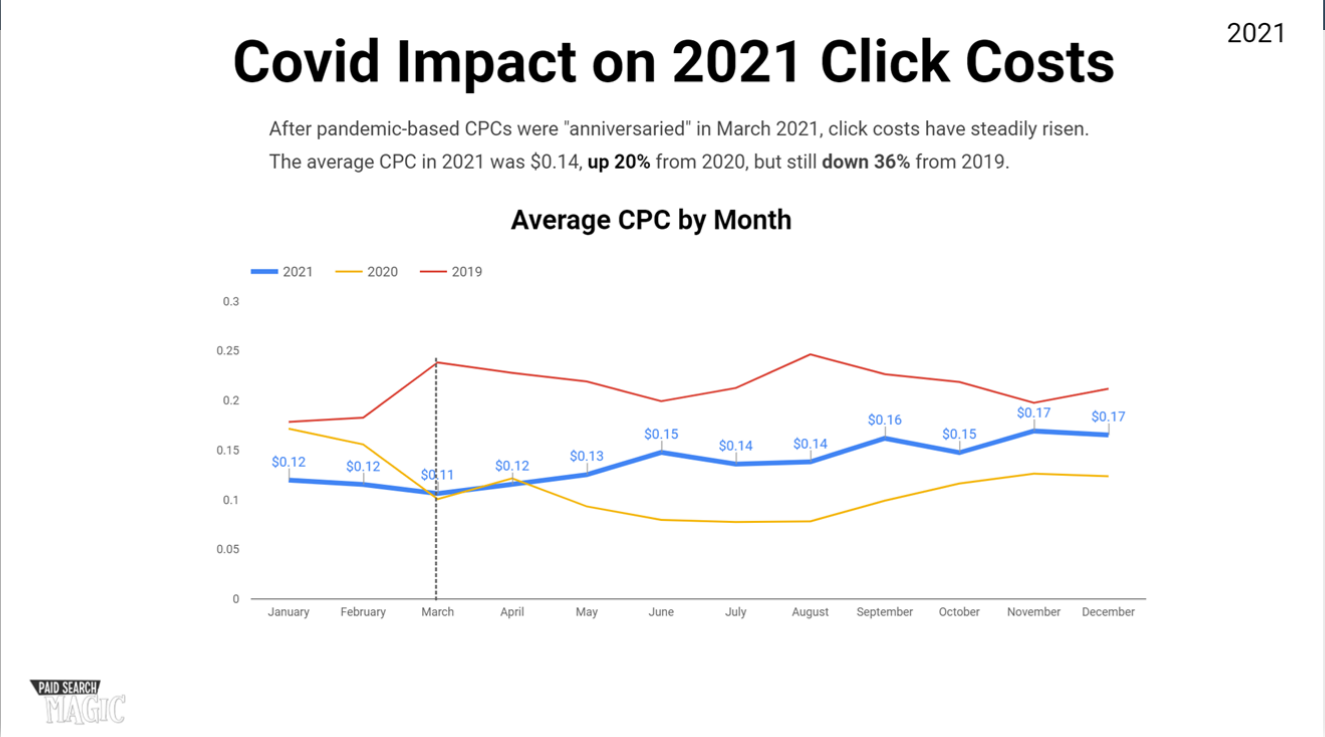
Challenge: The client needed to understand the impact of COVID-19 on click costs over time, which dramatically affected spend and ROAS.
Solution: The report page includes a time series chart comparing previous years to current, emphasizing current year with data labels and line thickness. It also distinguishes the beginning of Covid's impact on ecommerce.
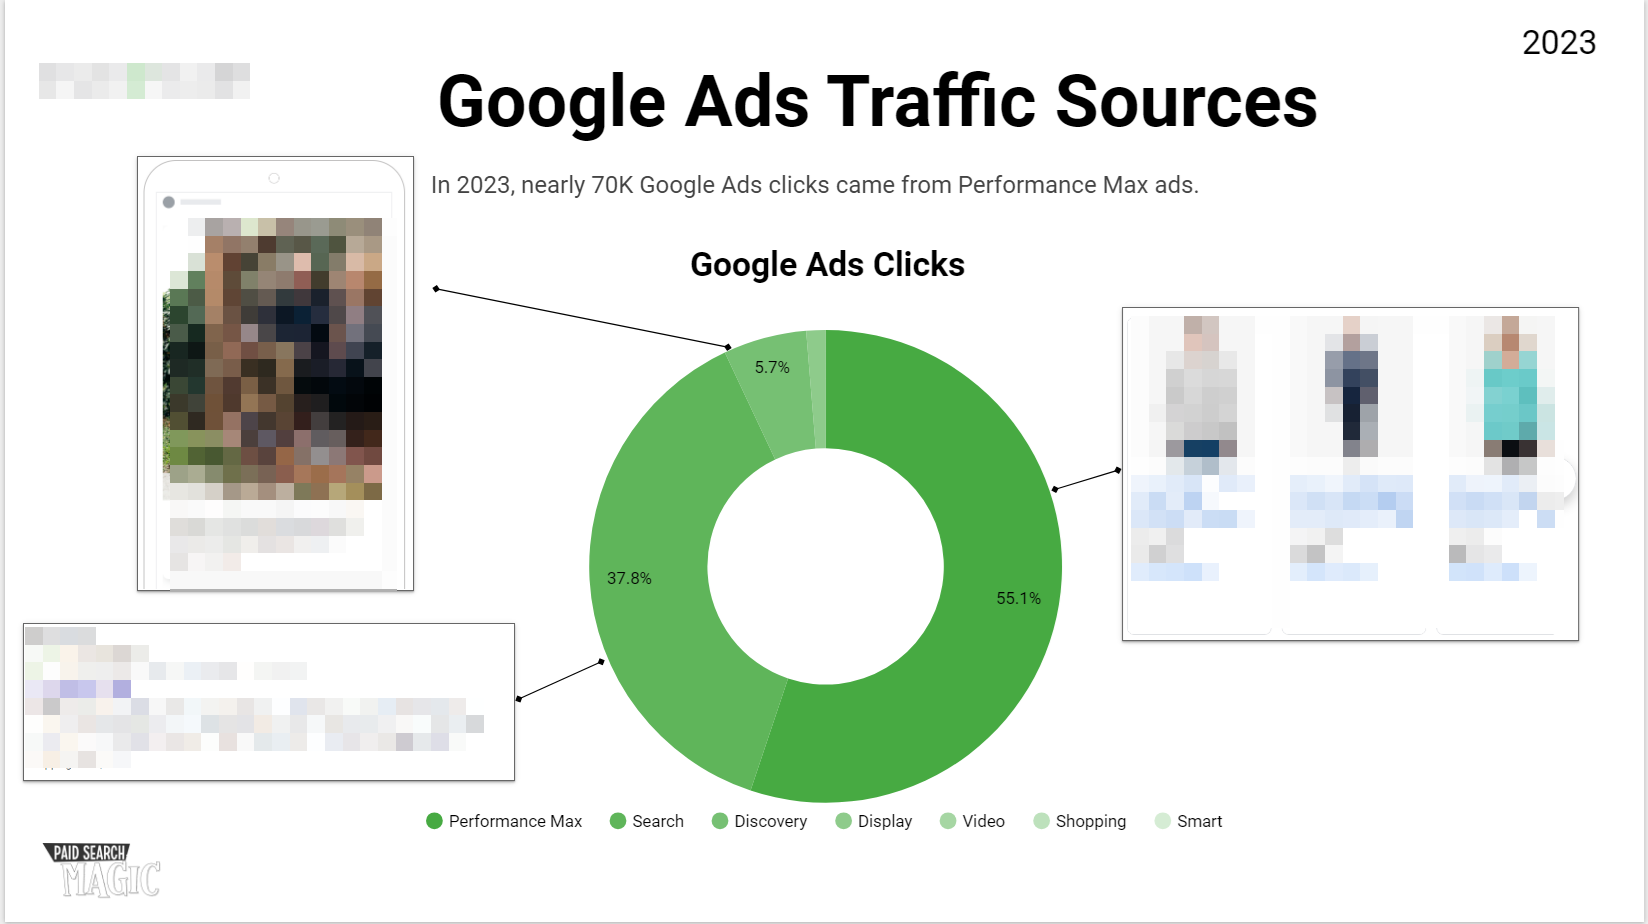
Challenge: The leadership team needed a high-level understanding of ad performance beyond "Performance Max vs Discovery."
Solution: The report page includes screenshots of client ad types, showing their percentage of total clicks.
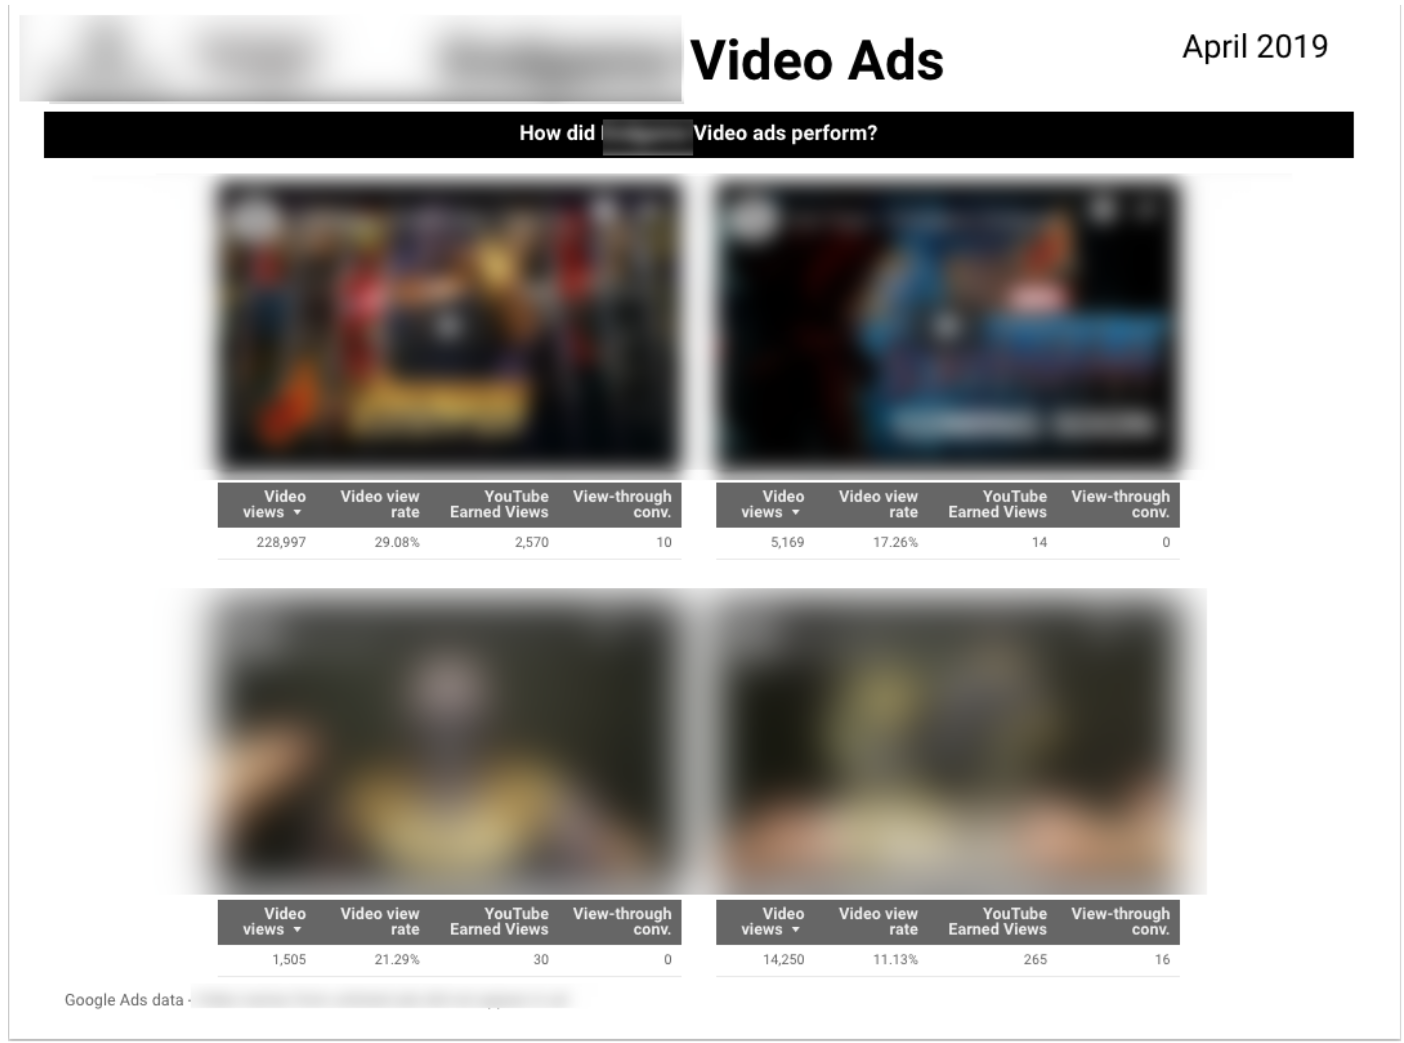
Challenge: Client was running multiple video ads and wanted to see and understand performance of the ads.
Solution: Report page includes embedded (playable) YouTube videos so client doesn't have to follow links or commit naming conventions to memory.
Challenge: The client had 3 distinct KPI goals for different paid media initiatives, and wanted to track performance at a glance.
Solution: The report page includes scorecards, MoM comparisons, progress towards goal, and a snapshot of the last 6 months for each KPI.

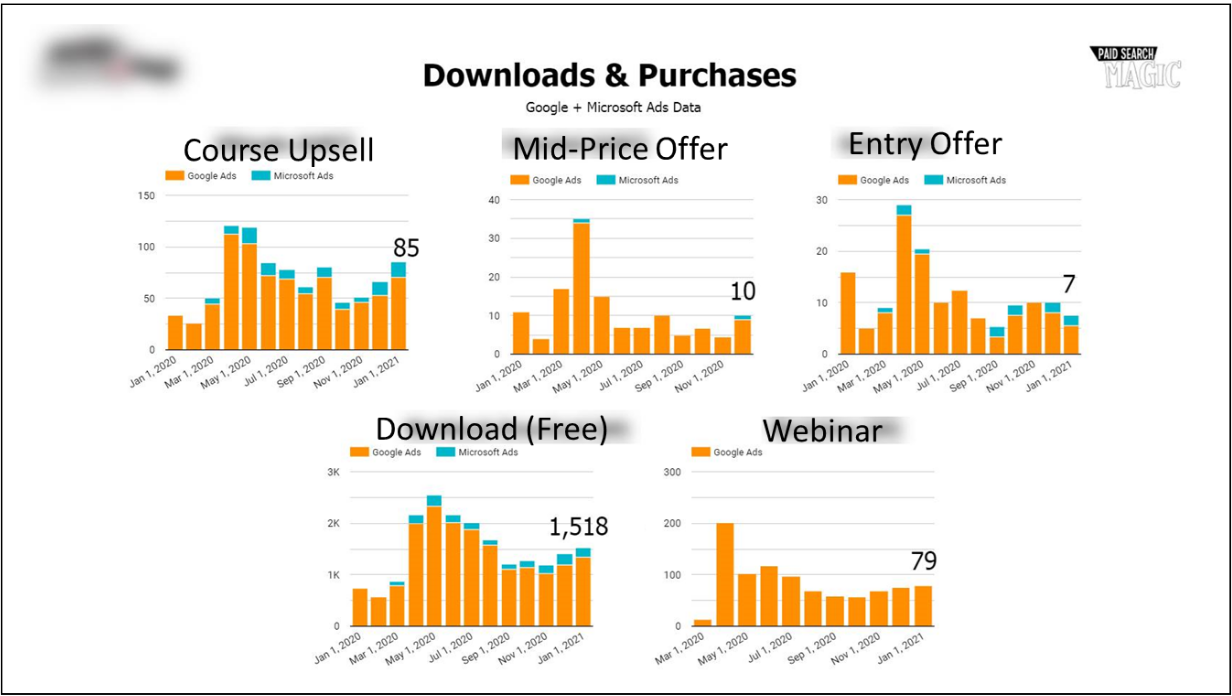
Challenge: The client needed to see performance over time for multiple conversion actions of different values.
Solution: The report page includes time series charts for each conversion action, segmented by Google and Microsoft ads, showing the current month's total.
Work with us
Get the training, support, and expertise to fuel your success.